

 The 25% drawdown from January reflects an unwind in gold's rate-sensitive layer, not a break in the structural bid. Real rates still govern marginal pricing, but fiscal dominance caps how far they can travel. The next leg begins when markets accept that the Fed's real-rate ceiling is binding.
Gold traded down to roughly $4,165 by mid-June, briefly touching the low-$4,000s intraday, after a reignited higher-for-longer regime erased the year's gains. The metal now sits about 25% below its January 28 record of $5,589, the deepest drawdown of the post-2022 cycle. Two catalysts compressed the rate-sensitive layer at once: an oil-driven inflation shock that priced out Fed cuts following the Iran conflict, and a firm jobs print that reinforced the same expectation. The question for cycle continuation is whether the two demand engines that carried gold from $1,800 to its peak, central banks first and Western and Asian ETFs second, have weakened temporarily or fundamentally.
The framework rests on two distinct bids. Central bank reserve diversification supplied the persistent baseline from 2022 onward. Western and Asian ETF inflows joined as a price-sensitive accelerator across 2024 and early 2026. Both pillars softened in the same window, which explains the depth of the move.
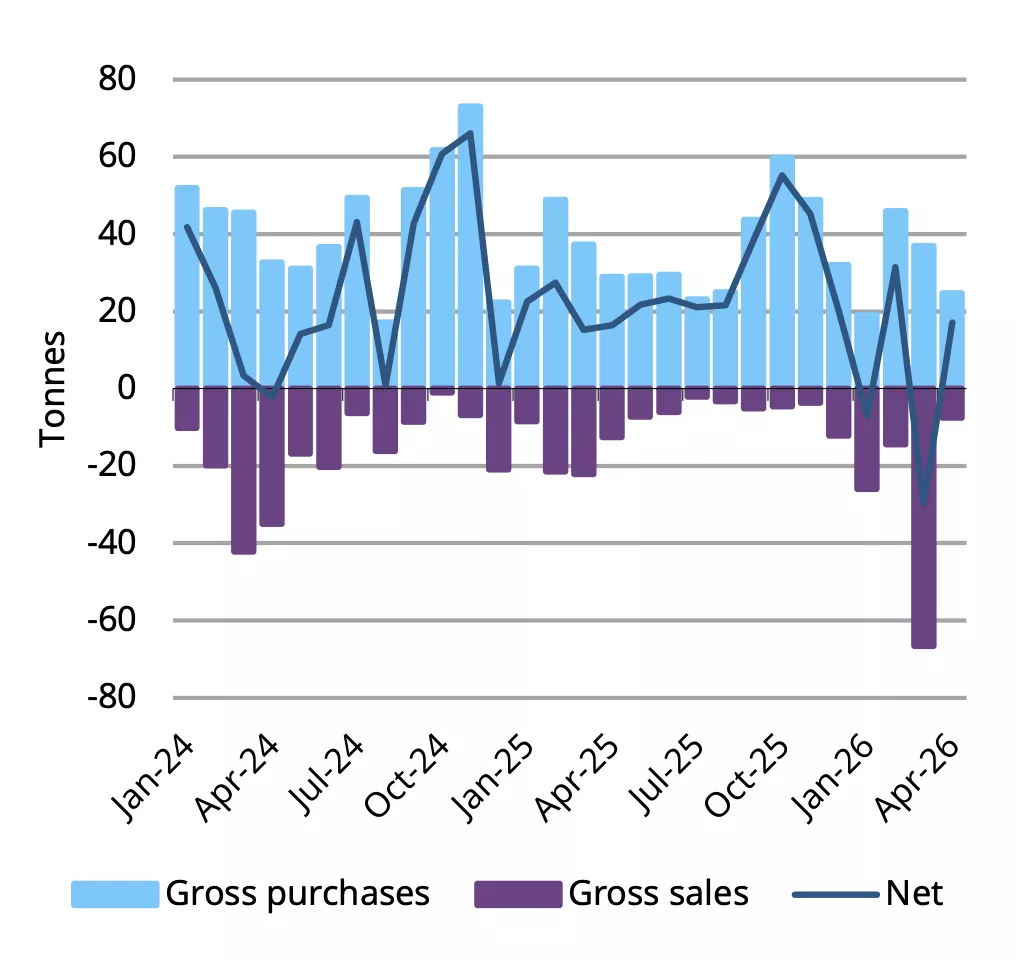
On the official sector, April net purchases were 17t per the World Gold Council, a rebound from March net sales but below the 36-month run rate. Poland led with 14t, China added 8t (its largest monthly buy since December 2024 and an eighteenth consecutive month), and the Czech Republic added 3t on its thirty-eighth straight month. Turkey, March's largest seller, was effectively flat in April after short-term gold/USD swaps used to defend the lira matured. Russia extended its net-selling streak to a fourth month with 6t, lifting year-to-date sales to 22t.
Central banks resume net buying in April
Year-to-date central bank gold activity
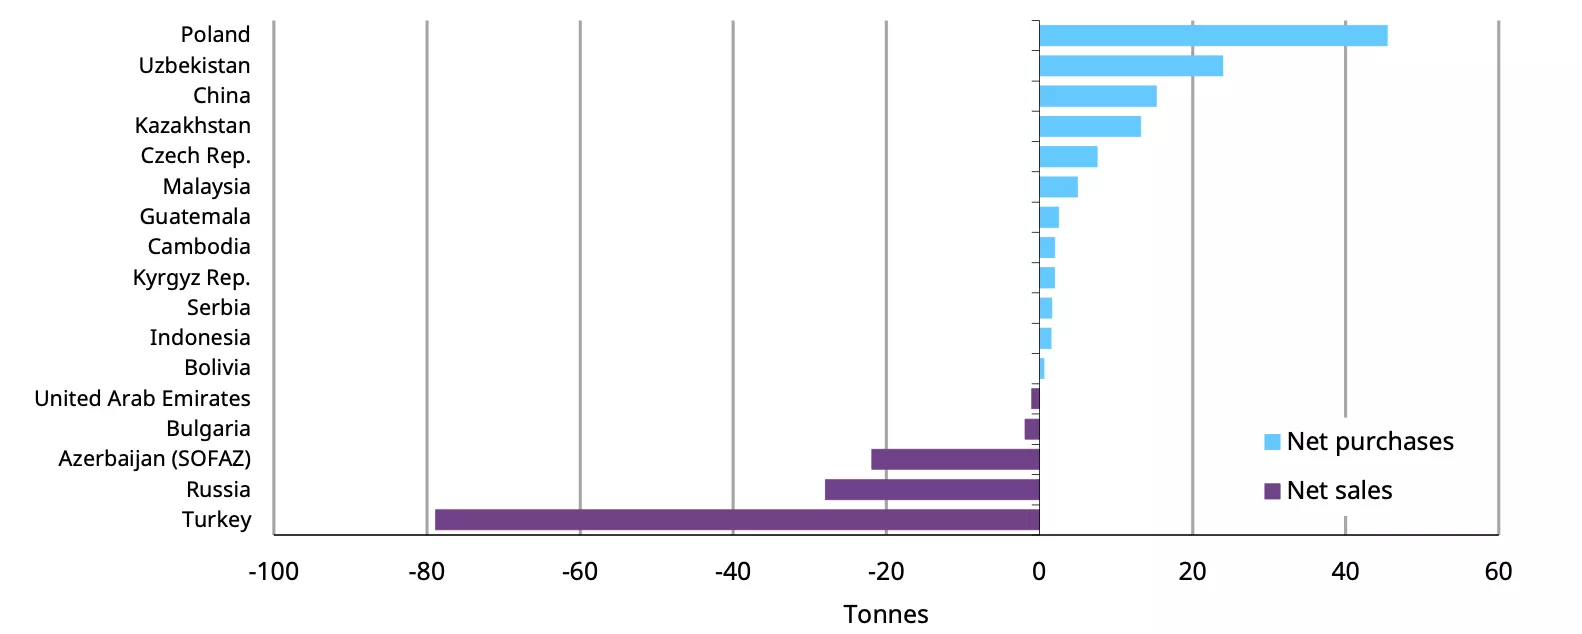
Source: World Gold Council, Central Bank Gold Statistics, June 2026
The slowdown is concentrated in reserve managers facing acute FX pressure. Turkey, Russia, and parts of the Gulf are mobilizing gold to defend currencies or fund deficits rather than to diversify away from dollars. This is event-driven, tied to the Iran conflict and the oil shock, not a reversal of the post-2022 diversification thesis. The Eastern Europe and Asia core, namely Poland, China, the Czech Republic, and Kazakhstan, remains net buyers and carries the bulk of cumulative flows.
On the ETF side, March produced record global outflows of US$12bn, the largest monthly redemption on record. The pace then moderated. US-listed funds added US$0.83bn in April and European funds added US$3.7bn. May reverted to modest global outflows of US$1.8bn, with Asian funds posting their first monthly outflow since August 2025.
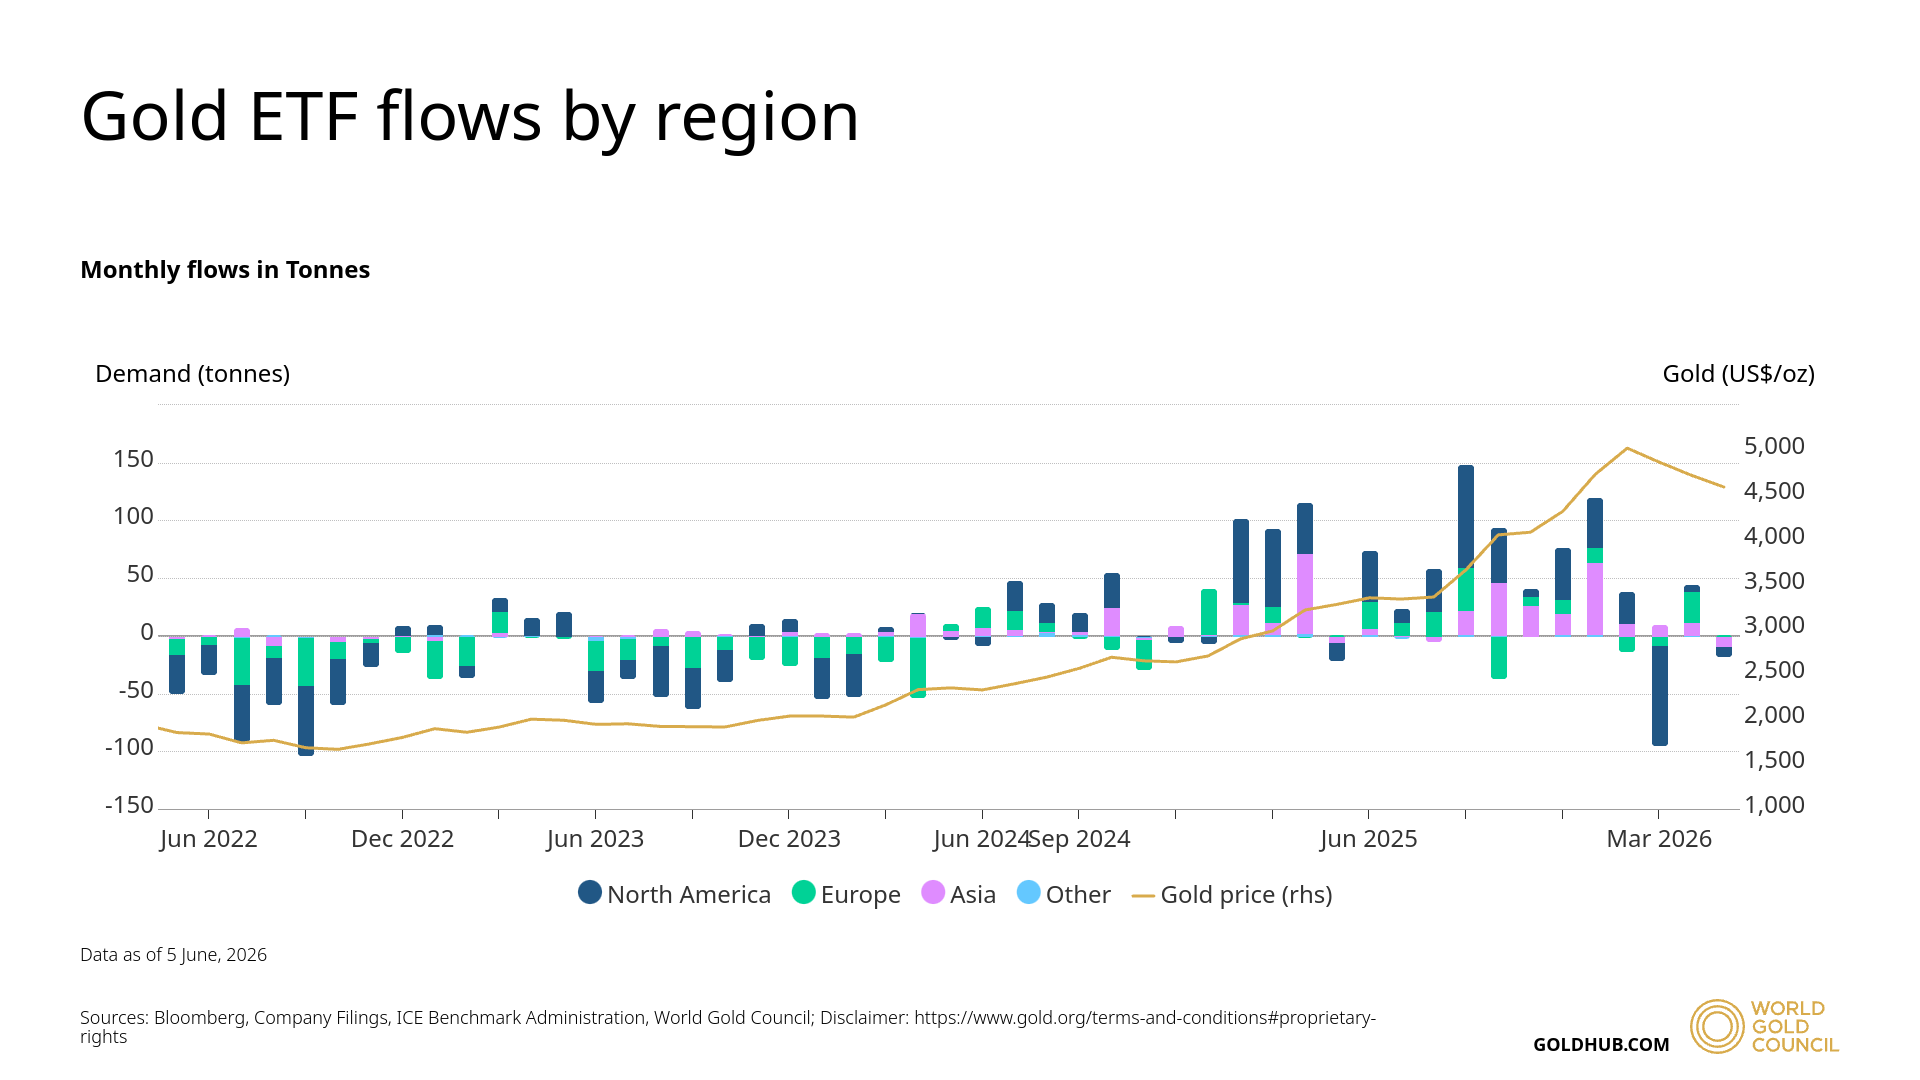
The two pillars differ by horizon. Central banks operate on multi-year reserve mandates and remain net accumulators; the exceptions are countries under FX or fiscal stress, not a change in intent. ETF flows respond to price momentum and rate expectations on a monthly cadence. The depth of a drawdown reveals which pillar is moving, and this one moved the monthly layer.
Real rates, nominal yields adjusted for expected inflation, once served as gold's long-run anchor. Higher real yields raised the opportunity cost of holding a non-yielding asset and pressured the price; lower real yields supported it.
Since 2022 that anchor has loosened. Gold rose alongside higher real yields through 2022 to 2025, carried by official-sector buying, Asian physical demand, geopolitical hedging, and mounting concern over persistent U.S. fiscal deficits. The relationship did not break so much as demote: real rates moved from structural anchor to marginal pricing factor.
Gold versus 10-year real yields
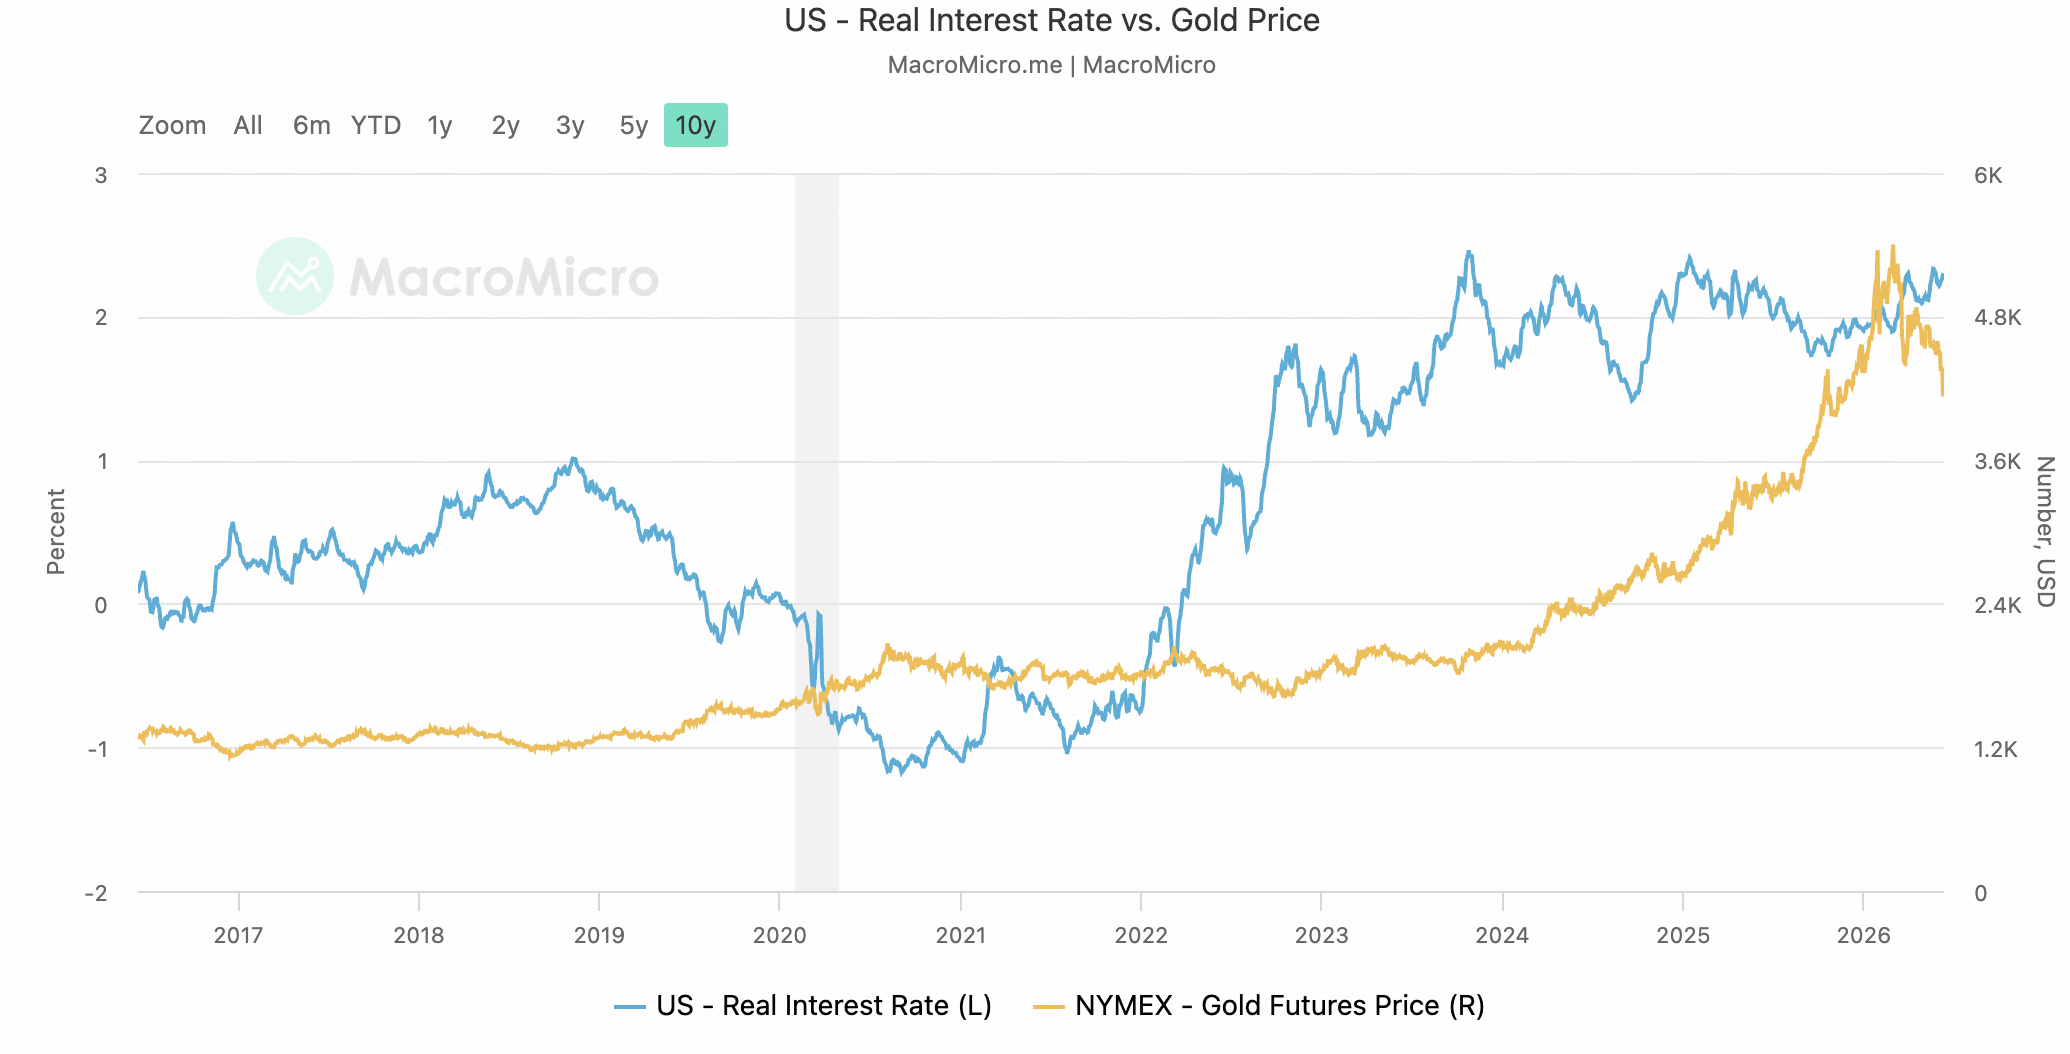
Source: MacroMicro
This reframing dissolves the apparent contradiction in the current selloff. A 25% drop on a rate-expectations shock looks inconsistent only if real rates are still the structural floor. They are not. Official purchases and Asian physical demand respond to reserve diversification, currency-risk hedging, wealth preservation, and geopolitics rather than to opportunity-cost models, and that is the part of the market that loosened gold's dependence on real rates. The 2024 to January 2026 rally, by contrast, also drew ETF inflows, futures positioning, and momentum capital. Those holders allocate through real-yield, dollar, and opportunity-cost frameworks, so when rate expectations repriced, the marginal layer unwound sharply while the structural bid held.
Real rates therefore still matter for short-horizon pricing, especially into crowded positioning. They no longer define the structural floor as they did before 2022. Gold has become less a pure real-rate trade and more a hybrid asset.
U.S. federal debt sits near $39T with annual interest expense already above $1T. On a full-refinancing basis, every 100bp rise in the effective funding rate would add roughly $390B to interest expense as maturing debt rolls at higher coupons. Persistent deficits in the 6 to 7% of GDP range mean the Treasury issuance pipeline cannot absorb prolonged high real yields.
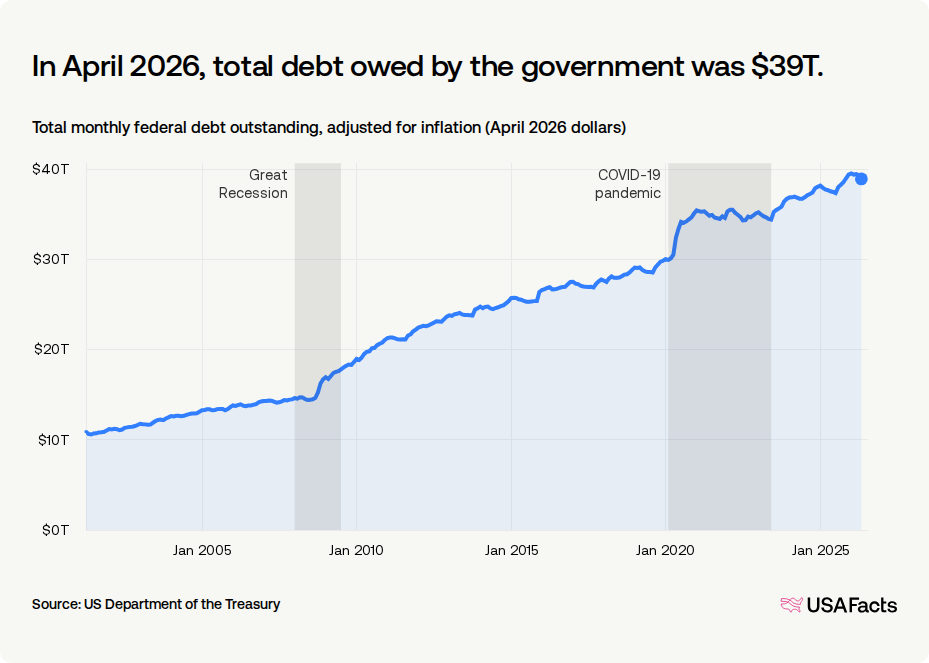
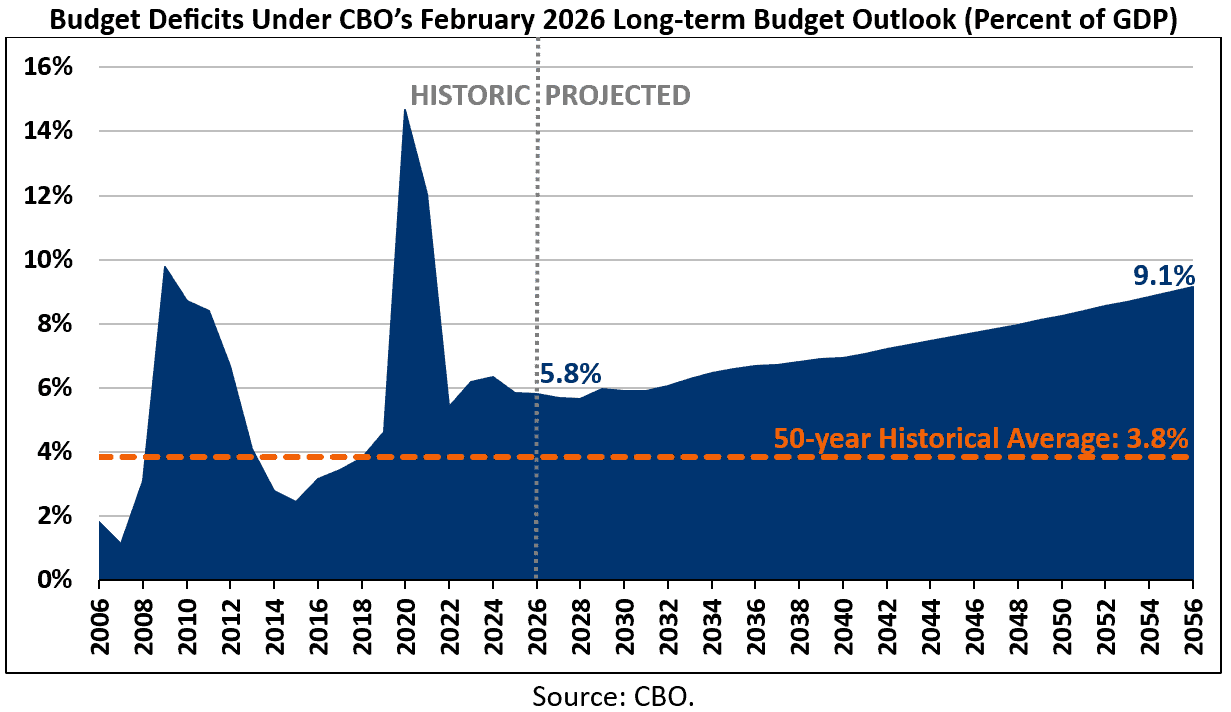
This is the fiscal dominance constraint: monetary policy is bounded by the need to keep debt service viable. The Fed can lift nominal rates against inflation prints, but the duration of that stance is limited. The longer real yields stay elevated, the heavier the debt-service burden and the issuance requirement become, and the greater the odds that fiscal stress pushes back against monetary restraint.
The base case holds nominal rates high enough to defend dollar credibility and contain inflation expectations, while real rates stay capped by issuance pressure, debt-service arithmetic, and limited tolerance for sustained term-premium stress. Liquidity remains selectively accommodative whenever long-end strain threatens broader market function.
Under this path gold consolidates rather than collapses. As the Iran shock unwinds and ETF flows stabilize, a $4,000 to $4,800 range into Q4 is the central expectation; the lower bound implies the June intraday low holds. That range describes a market where rising rate expectations keep pressing while the structural floor from official demand, Asian physical buying, fiscal-risk hedging, and reserve diversification stays intact.
The asymmetric upside needs a recognition event. Markets must begin to price that the Fed cannot hold policy restrictive long enough to force inflation lower without making the debt-service arithmetic visibly unstable. The trigger is not a simple rate-cut signal but the moment the market concludes the real-rate ceiling is real. Once that constraint becomes visible, gold reasserts its role as the hedge against the limits of monetary credibility, and the cyclically compressed structural bid does the rest.
 APP
APP
