

 4m
4m
Pi Cycle Indicators consist of two indicators: Pi Cycle Top and Pi Cycle Bottom. They are commonly used to identify the market top and bottom of the crypto market and determine market cycles. The Pi Cycle Indicator utilizes SMAs of Bitcoin over different time periods to identify the market cycles.
Simple Moving Average (SMA), also known as the "arithmetic moving average," is a line that represents the average price of an asset over a specific time period. It is one of the fundamental indicators used to observe price fluctuations. For example, the Bitcoin 111 SMA is a line generated by calculating the simple average of Bitcoin prices over a period of 111 days.
The factors of 2x and 0.745x in these indicators were derived from previous random experiments (you can understand it as finding patterns). Historically, the crossing points of the SMAs derived from these multipliers have accurately reflected the lowest and highest points in Bitcoin prices. Therefore, they have been consistently applied in the Pi Cycle Indicator.
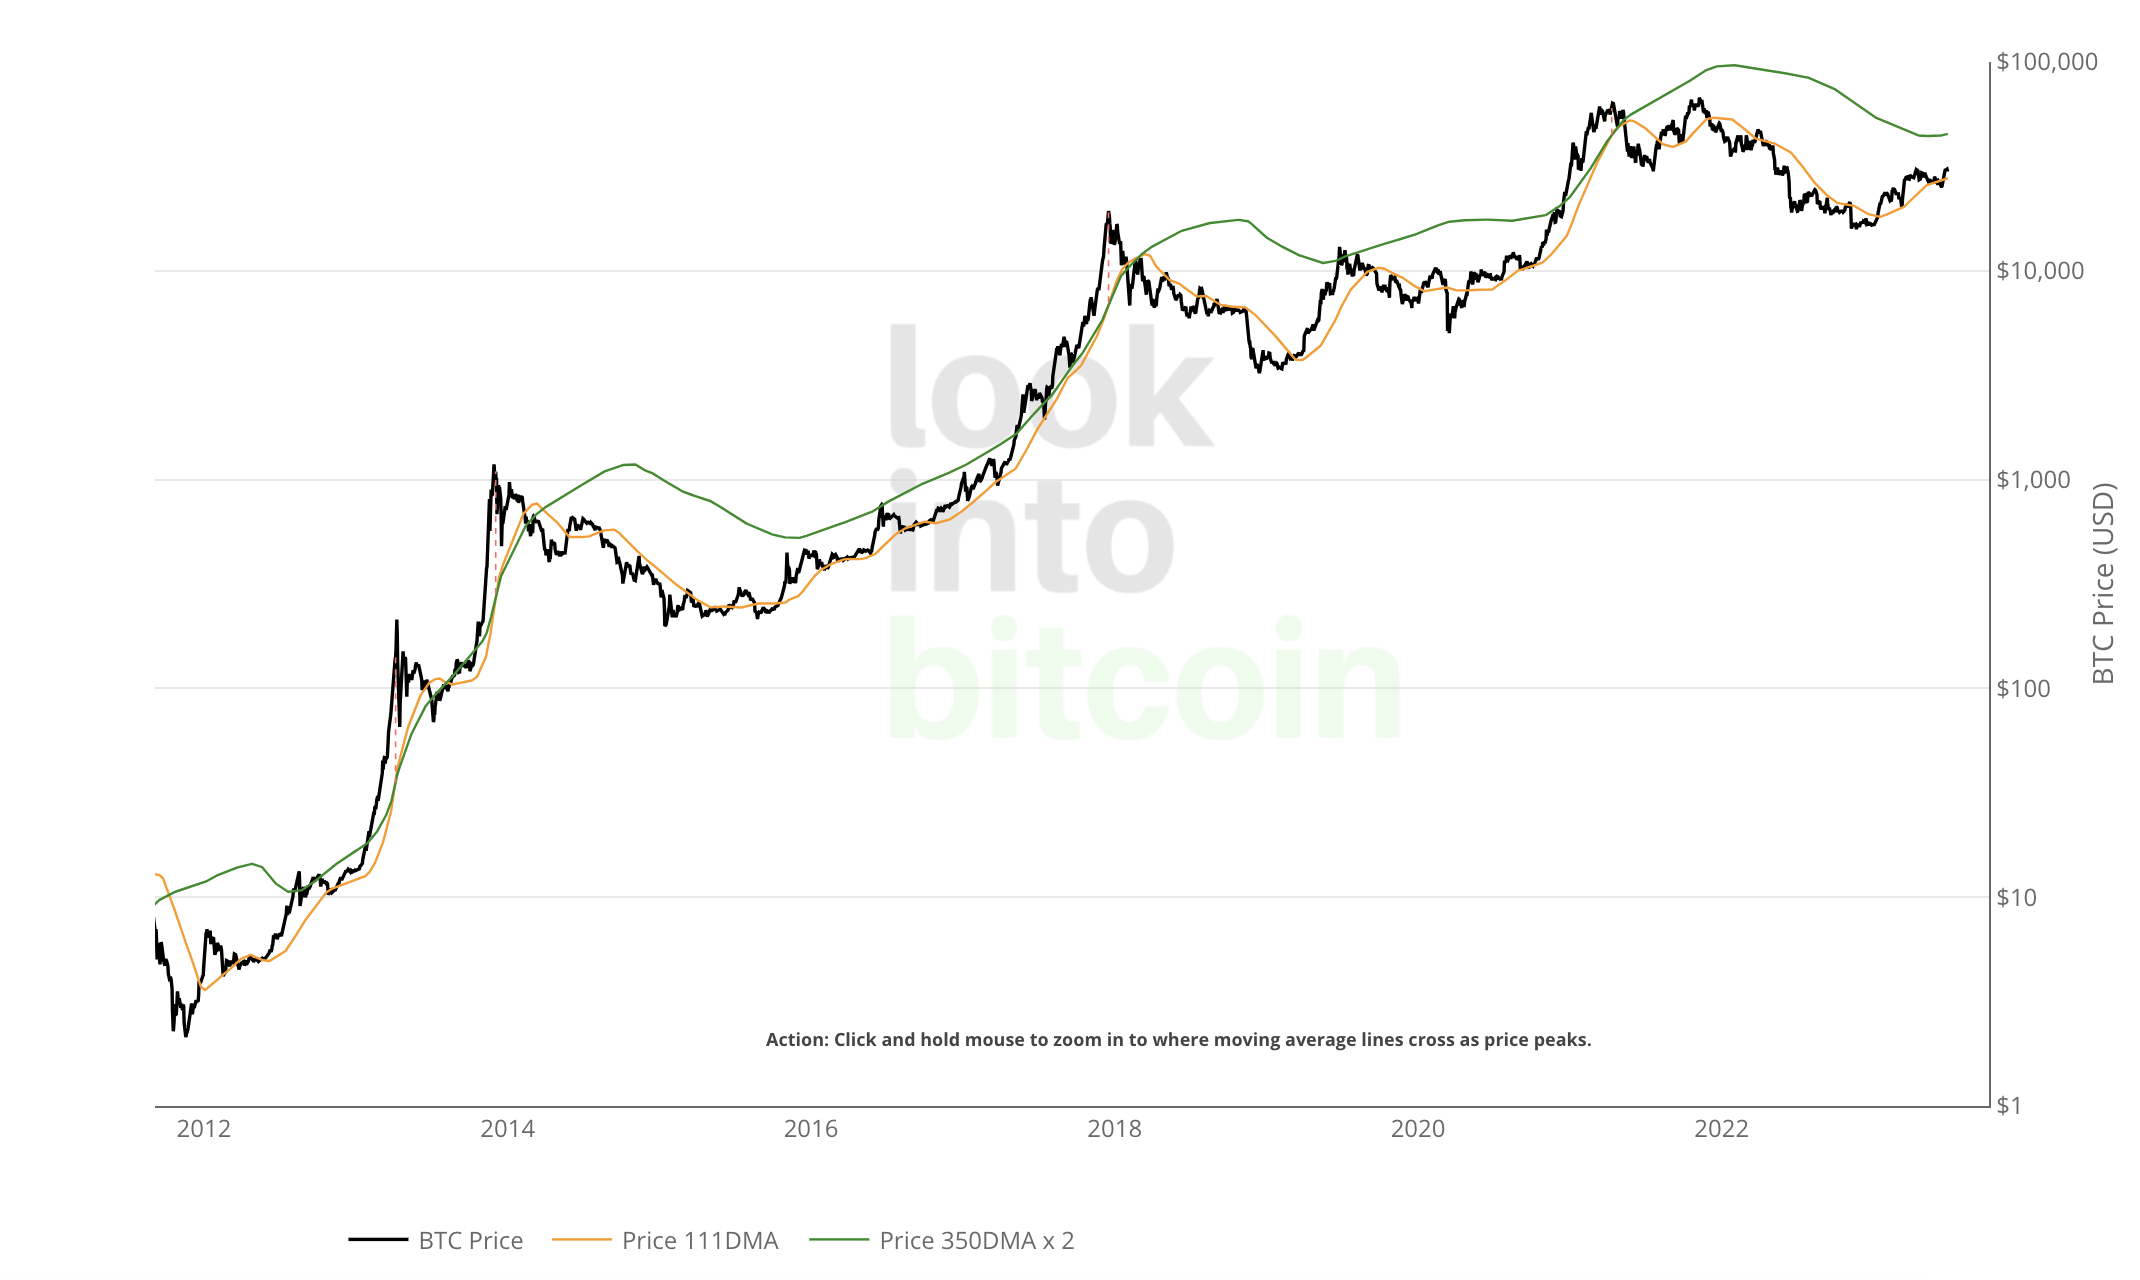
When analyzing with Pi Cycle Top Indicators, the overlapping point between the 111 SMA and 2*350 SMA is considered a potential high point in the market, indicating that the Bitcoin price is about to reach a temporary or long-term peak. Conversely, the overlapping point between the 471 SMA and 150 SMA implies a potential low point in the market, indicating that the Bitcoin price is about to reach the lowest value within the cycle.
For example, looking at the past four market cycles, it is evident that when the 111 SMA moves upward and crosses over the 2*350 SMA, the Bitcoin price reaches a peak, and the market enters the top, followed by a gradual decline in price.
 APP
APP
