US equities fell this week — the S&P 500 down 1.86%, the Nasdaq-100 down 2.77%. Gold rose, Bitcoin broke $70,000, and $1.61 billion flowed into US spot Bitcoin ETFs across four sessions. The dollar fell 0.88%. Credit spreads remain tight at 273bp. This is not risk-off. It is capital rotating out of dollar-denominated financial assets and into non-sovereign ones.
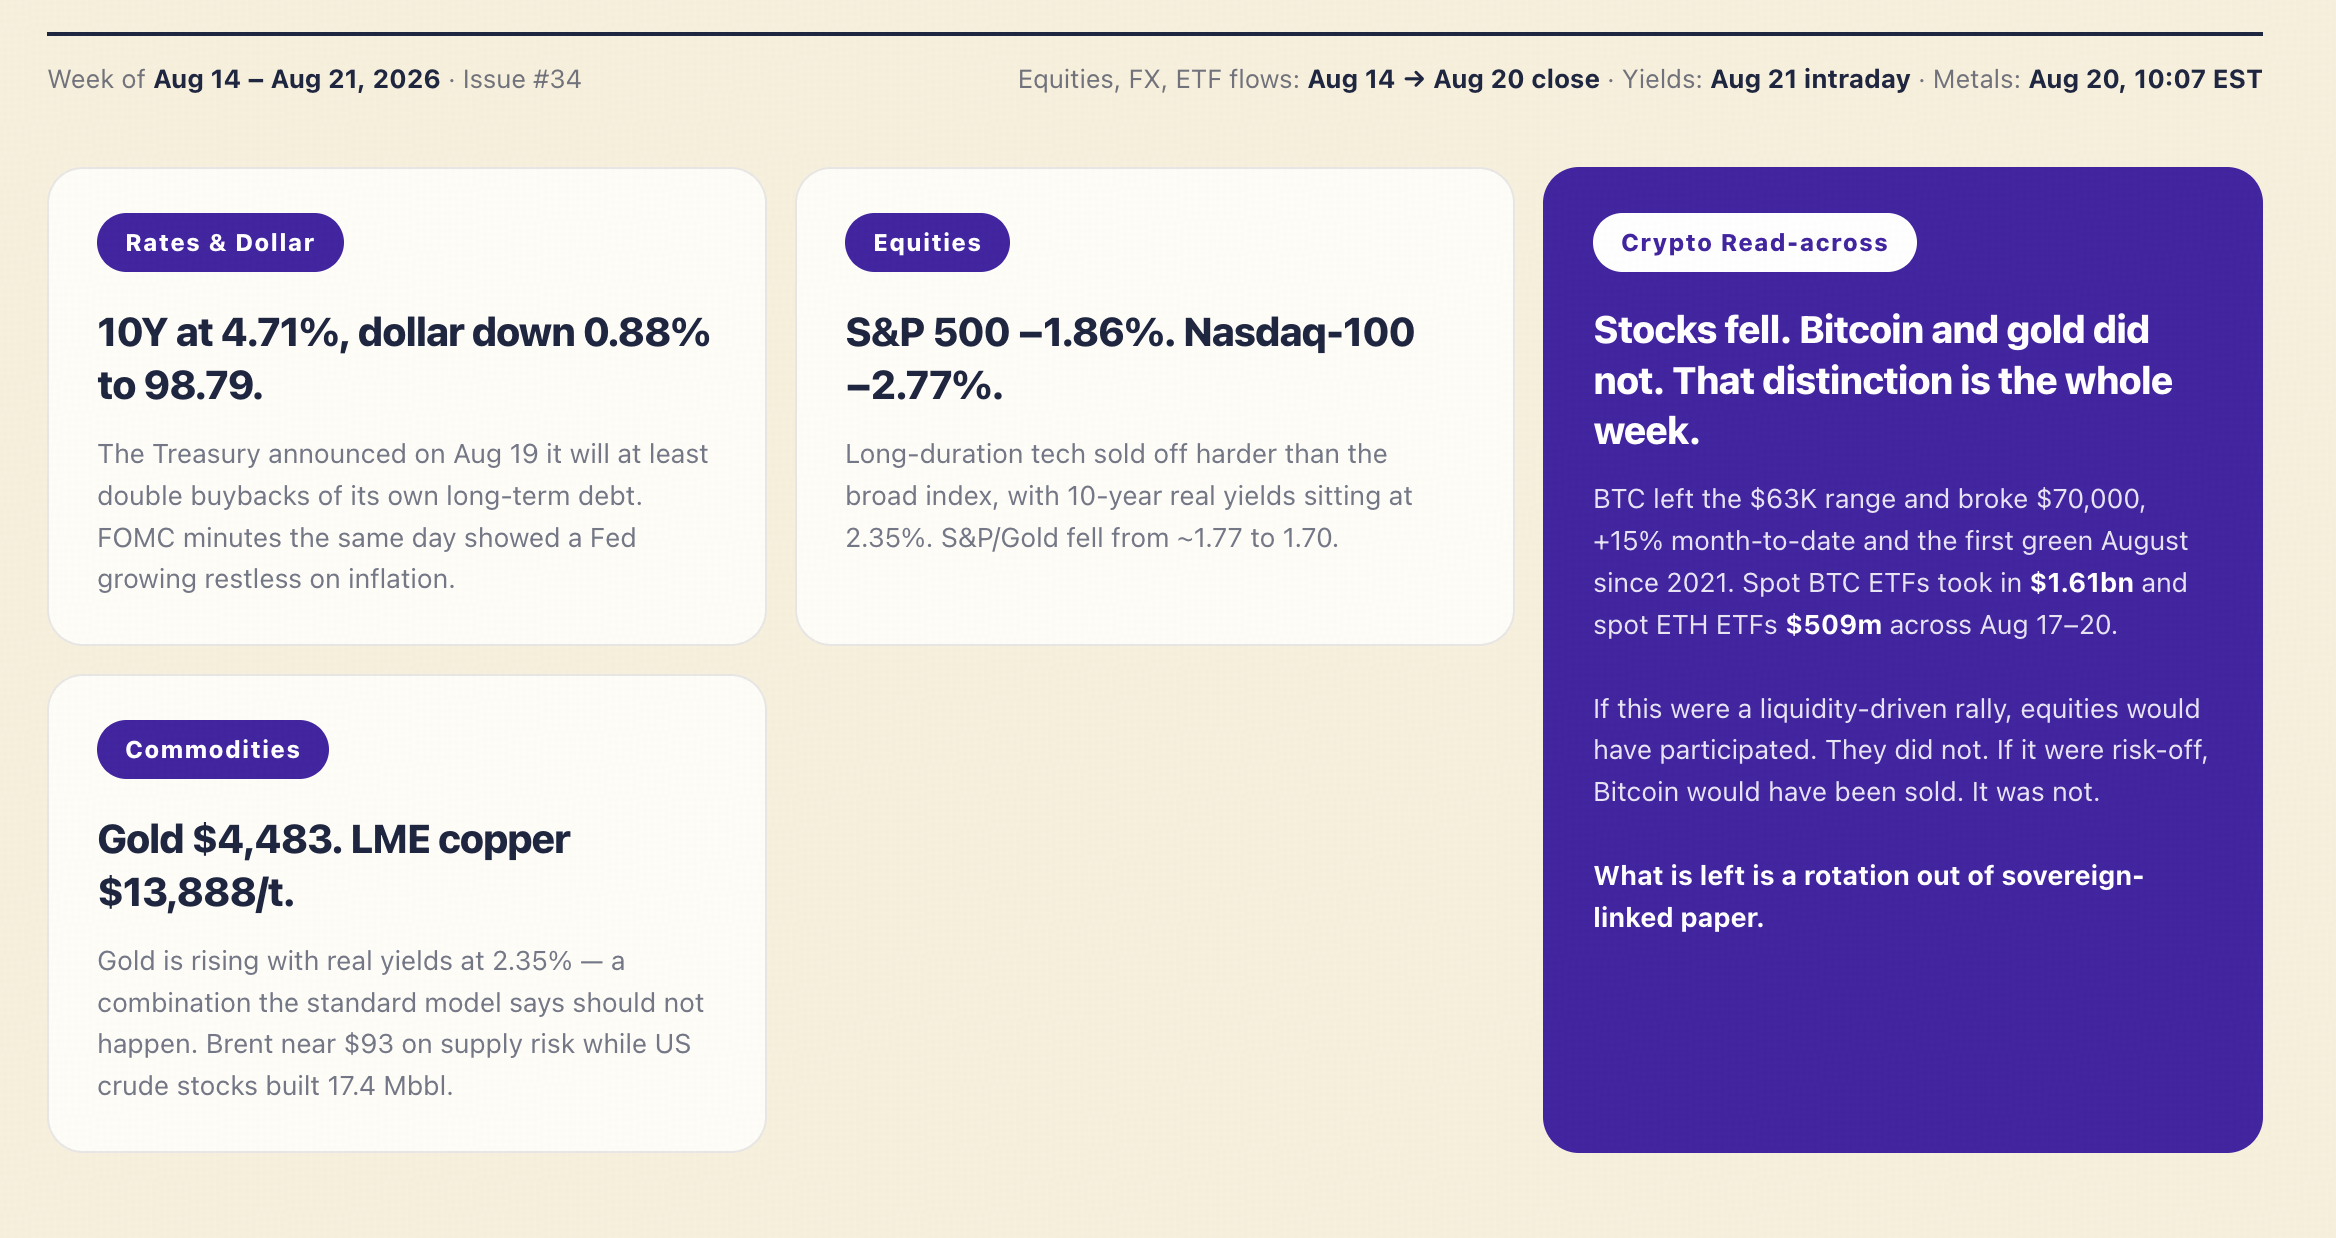
Equities and the dollar fell together while gold and Bitcoin rose. That specific combination rules out both a liquidity rally and a risk-off panic, and leaves one reading: money moving out of dollar-denominated claims.
Reading the map⬇️
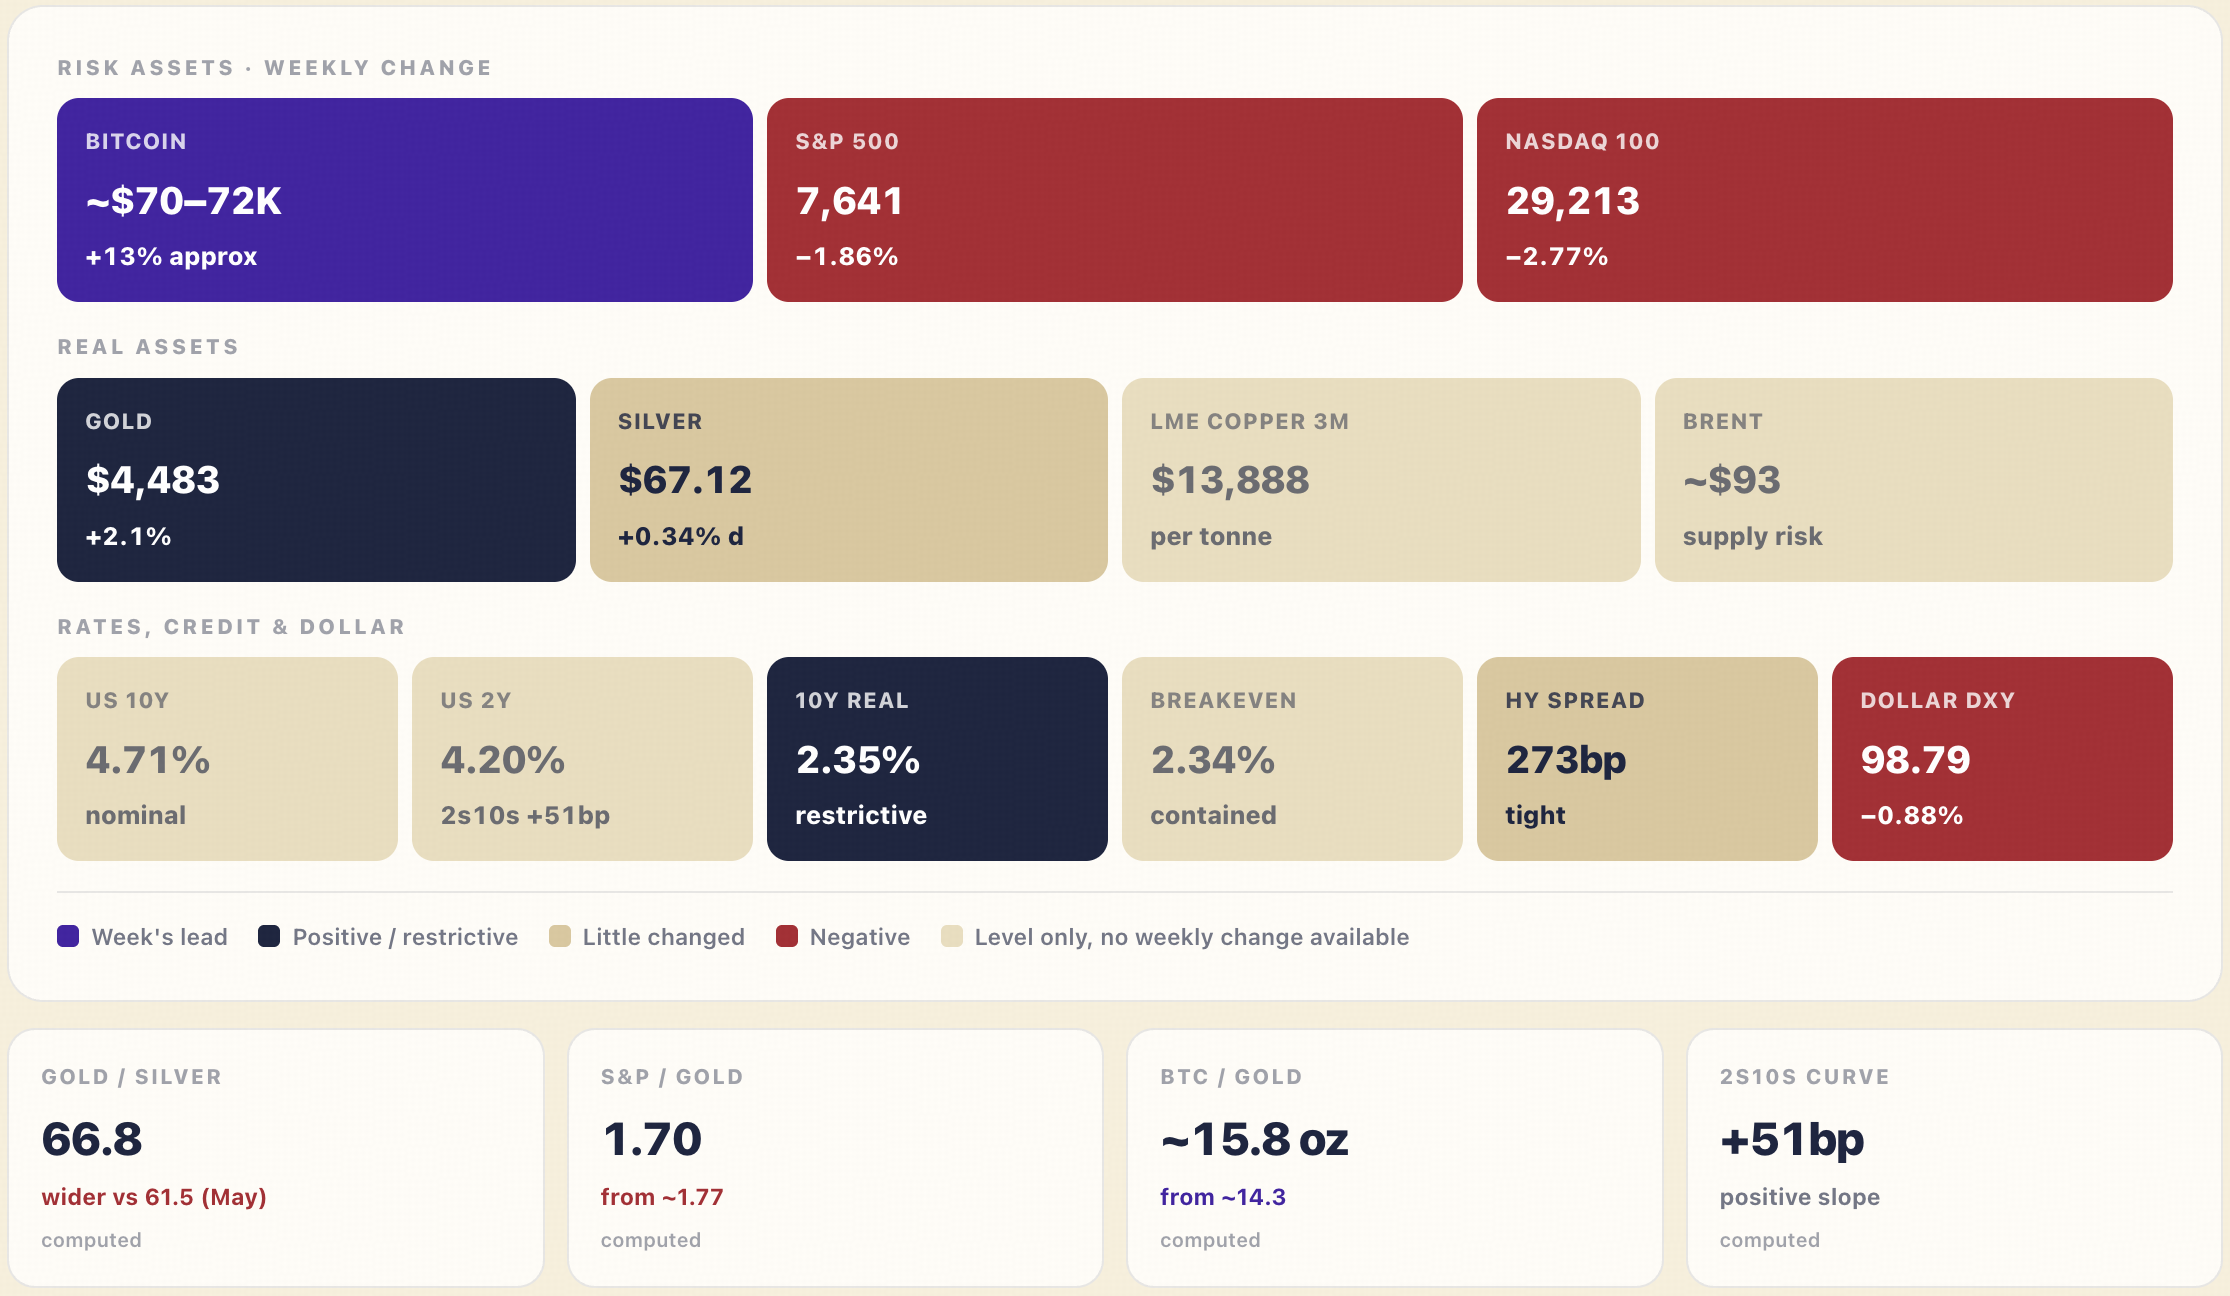
1️⃣The Nasdaq-100 fell hardest, and that is a duration effect rather than an earnings problem. With 10-year real yields at 2.35%, the assets whose cash flows sit furthest in the future get repriced first. Nothing in this week's tape suggests a deterioration in corporate earnings.
2️⃣The two red tiles that matter most sit on opposite sides of the map. Equities down and the dollar down at the same time is unusual — a weaker dollar normally supports US equity multiples through the earnings translation channel. When both fall together while hard assets rise, the shared explanation is the denominator, not the numerator.
3️⃣ What is missing from the map is stress. High-yield spreads at 273bp are tight by any historical standard. This was not a credit event.
Gold is rallying with 10-year real yields at 2.35% and inflation expectations at only 2.34%. Neither the discount-rate channel nor the inflation channel explains it. What remains is a sovereign-credibility premium.
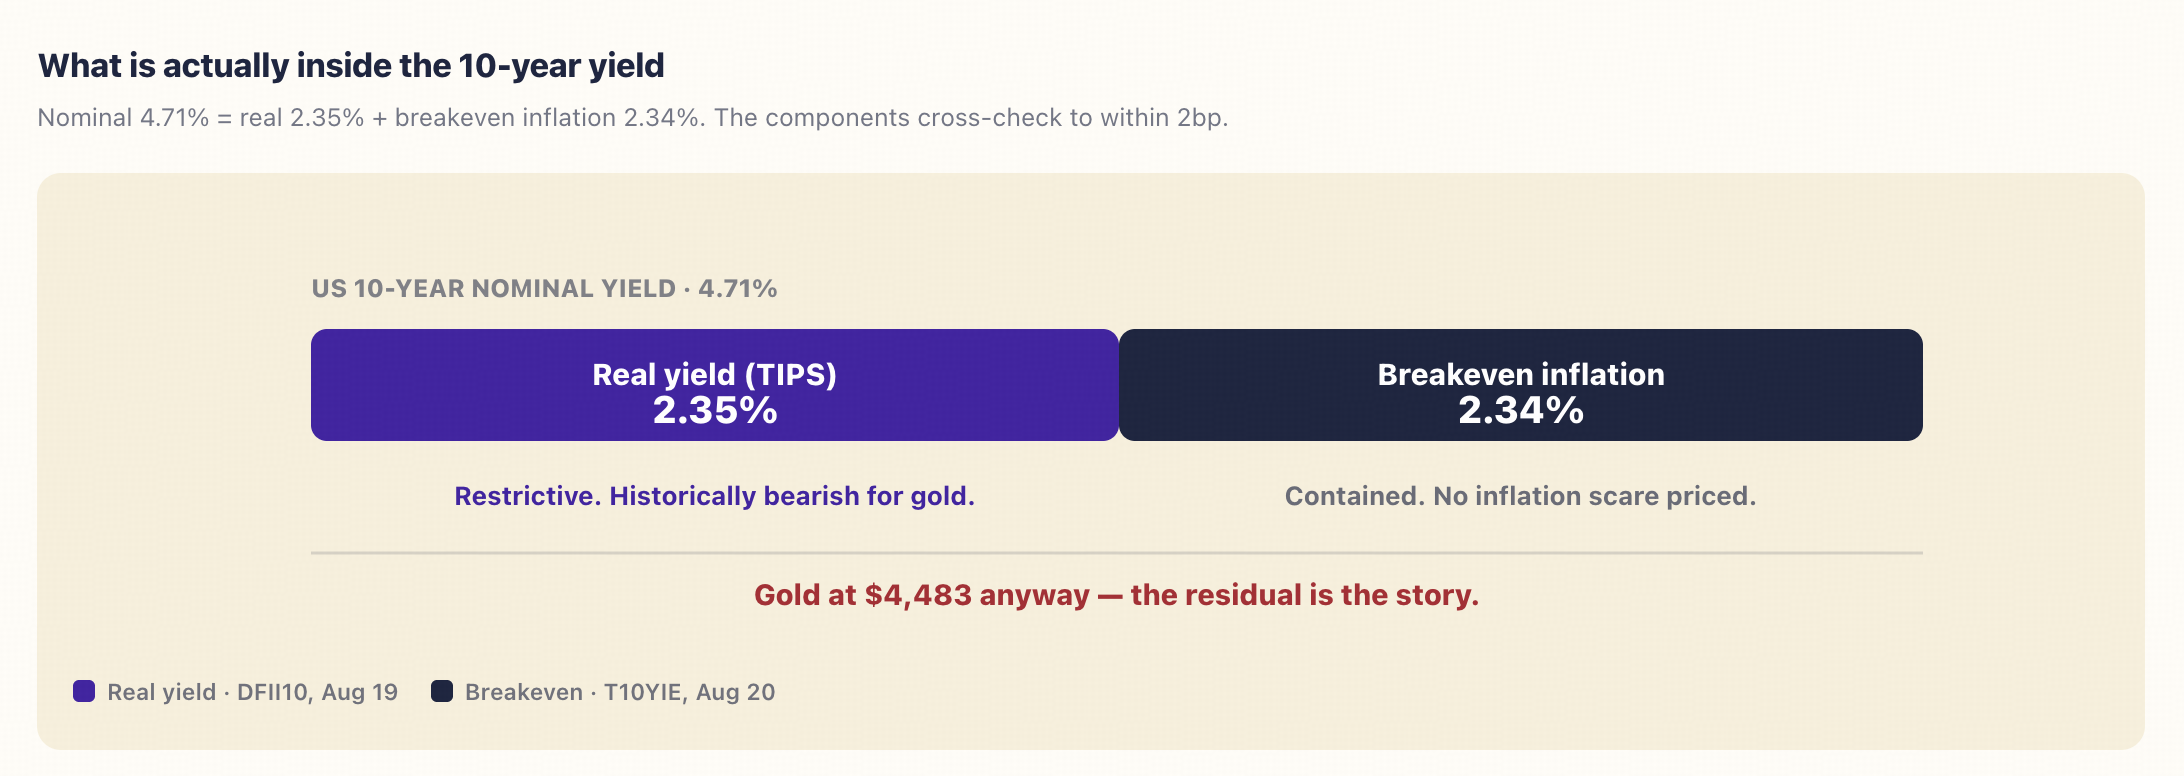
Gold pays no coupon, so a 2.35% real yield is a direct 2.35% annual cost of holding it. On the textbook relationship that is a strong headwind. And with breakevens at 2.34%, the market is not pricing an inflation problem either — so this is not an inflation hedge trade. When both standard channels point down and the asset goes up, the explanation lies outside the model: investors are paying a premium for an asset that is not anyone's liability. That premium is what a Treasury buying back its own long bonds, while its central bank frets about inflation, tends to produce.
1️⃣Credit says there is no stress and that settles a question
US high-yield spreads closed at 273 basis points, tight by any historical standard. This week's equity decline was not a credit event and not a dollar squeeze.
The distinction is practical. In a genuine funding squeeze everything gets sold for cash — gold and Bitcoin included, because they are liquid. That is what happened in March 2020. Here spreads are tight, the dollar is falling, and hard assets are bid. The equity decline is a repricing of duration and valuation, not a solvency scare.
2️⃣ One qualifier on the buyback rally: the money has not moved yet
The Treasury's announcement raised the cap on buybacks of 10-, 20- and 30-year paper. Reporting indicates the operations themselves do not begin until September 9. What repriced this week was the announcement, not the bid.
That matters for how much of the move is durable. Between now and then the long end has to absorb a heavy auction calendar on its own. What to watch: whether long-end demand holds without the buyback bid underneath it — the auction results over the next three weeks are the test.
The ETF bid turned on August 17 — two sessions before the Treasury announcement. The policy news amplified a rotation that was already underway rather than starting it.
Bitcoin spot ETF net flows, daily
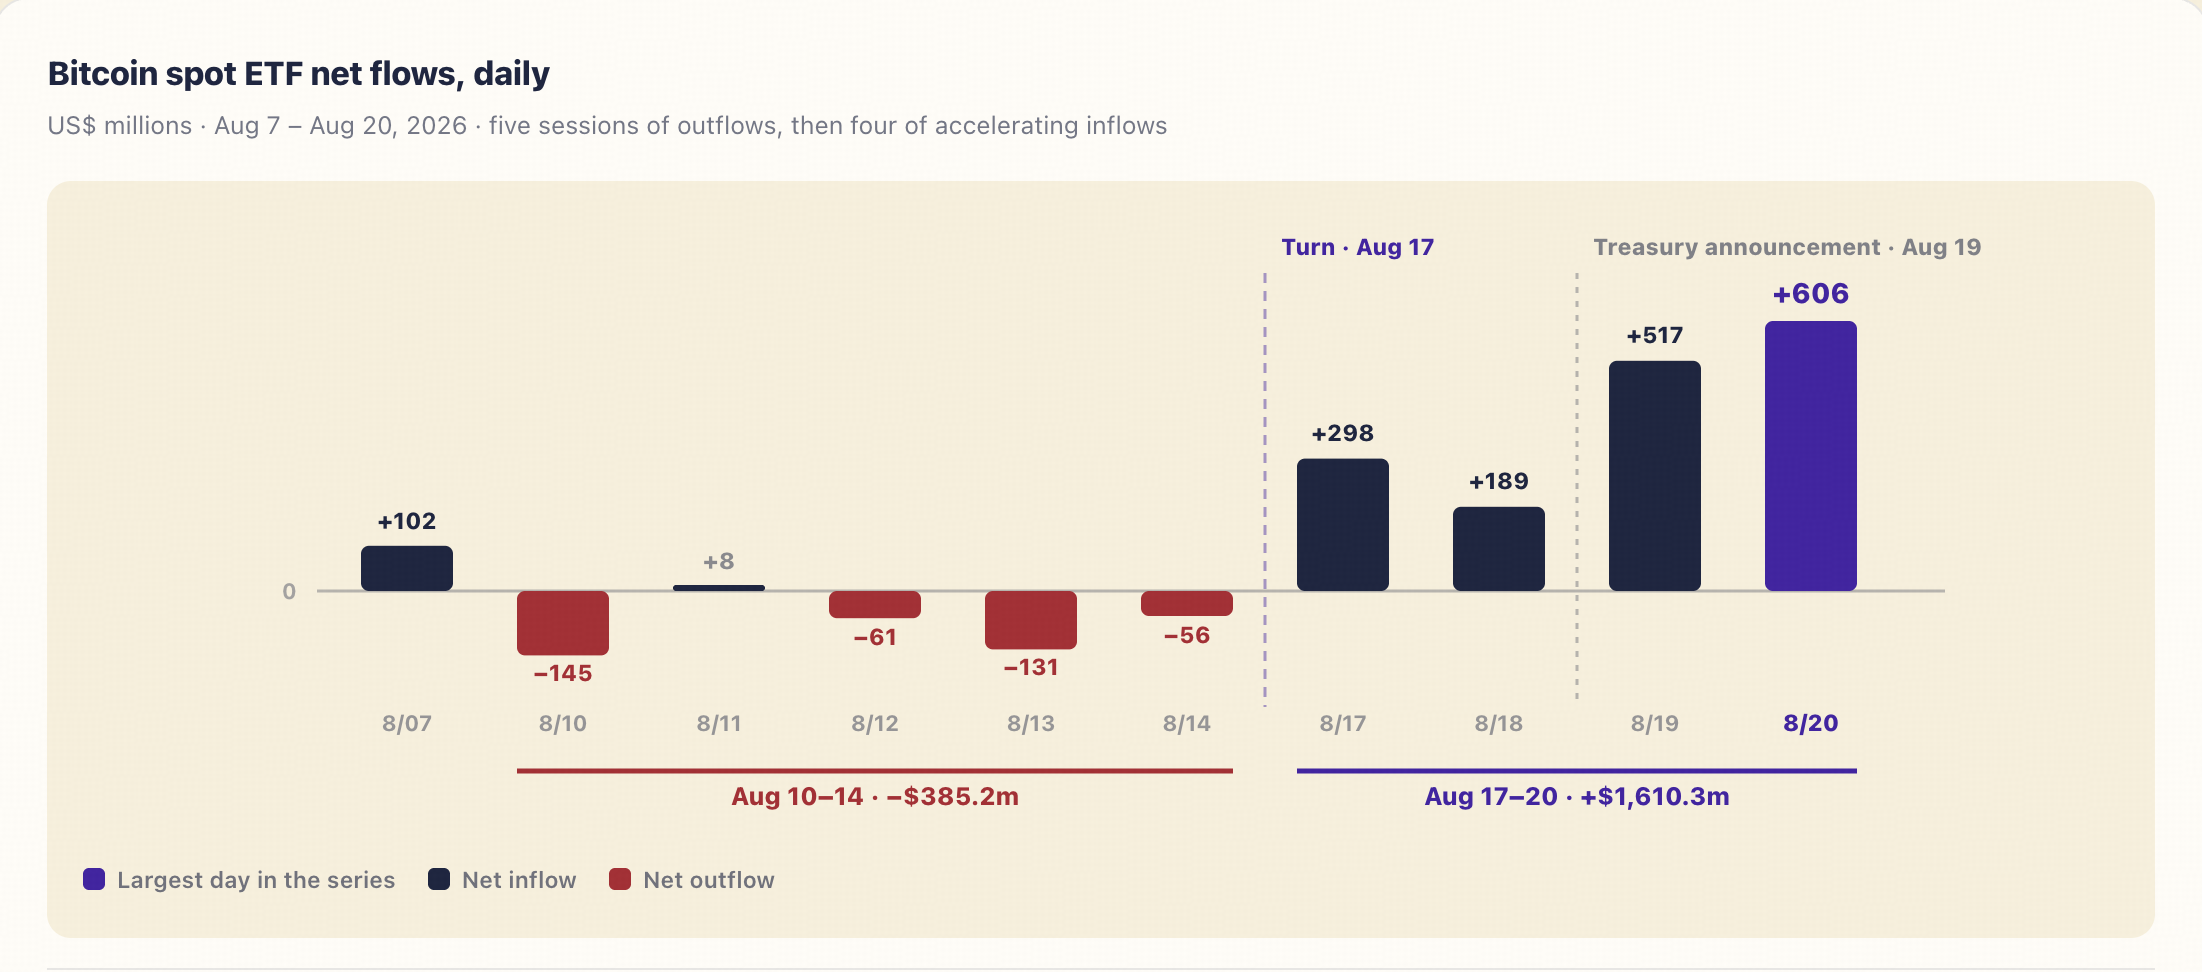
The daily series changes the causality. Aggregated, the week reads as a response to the Aug 19 Treasury announcement. Daily, it does not: the bid turned on Aug 17 with +$297.5m, and Aug 18 added another +$189.3m — both before the news. The announcement then amplified an existing move, taking Aug 19 to +$517.2m and Aug 20 to +$606.3m, the largest day in the series. The swing between the two periods is close to $2bn.
Ether spot ETF net flows, daily
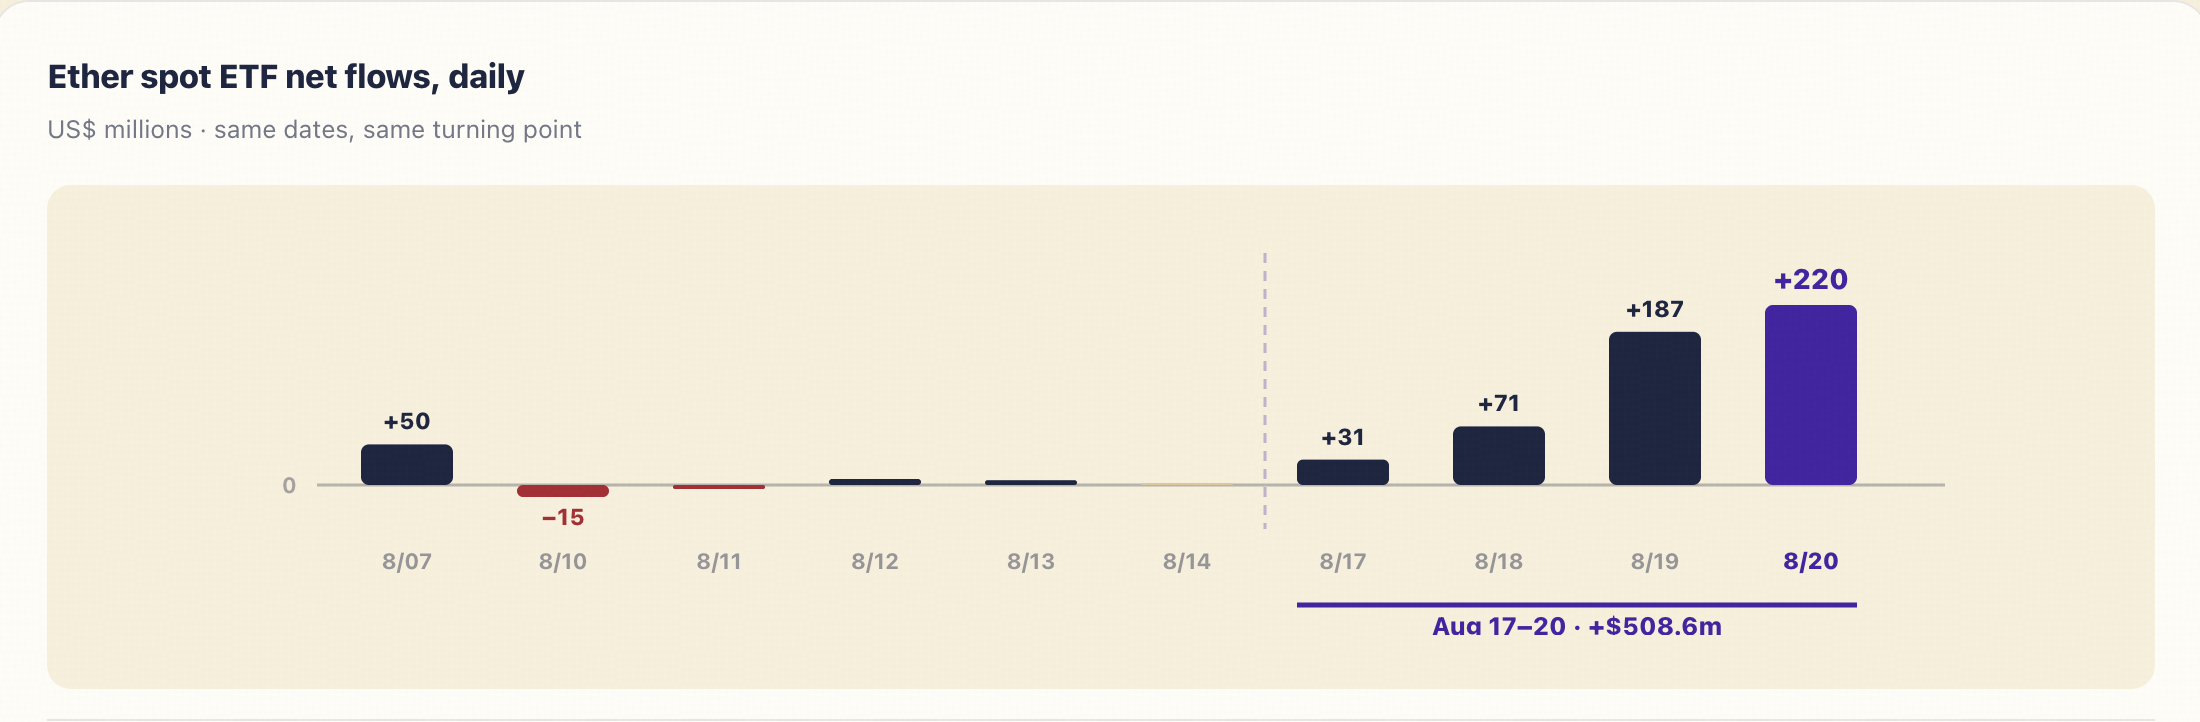
Ether followed the same dates almost exactly, turning positive on Aug 17 and posting its two largest days on Aug 19 and Aug 20. Two assets moving on identical dates suggests a single allocation decision across crypto rather than two asset-specific ones. Cross-check: our sum of the daily prints (+$1,610.3m Bitcoin, +$508.6m Ether) reconciles exactly with the reported weekly totals — the series is internally consistent.
Most of Q2's central bank gold buying was never reported
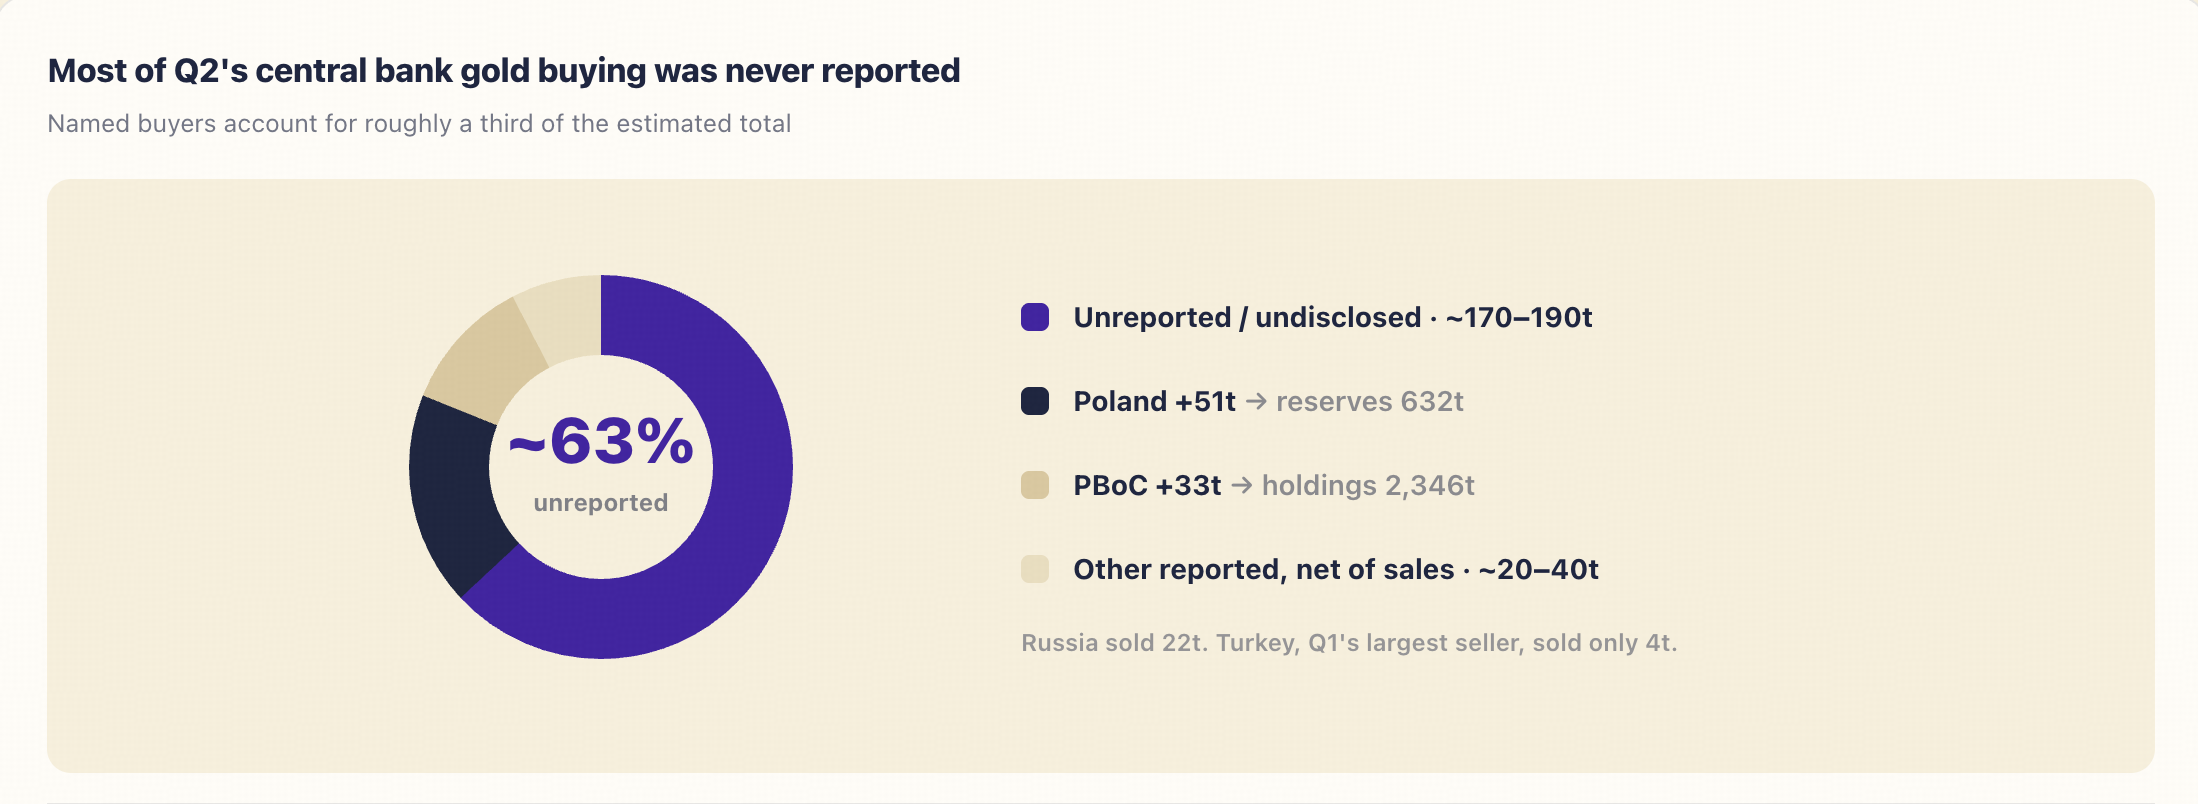
Our calculation, not the WGC's. Named purchases total roughly 127t against reported sales of about 27t — call it 100–120t of net reported activity against an estimated 288.9t. The WGC separately notes that unreported buying "was again elevated in Q2." Two implications: official statistics continue to understate real official-sector demand, and the gap between estimate and disclosure is itself a variable worth tracking. Q2's 288.9t was a record for any second quarter and came while the gold price fell — but the H1 total of 345t, with Q1 at a revised 57t, was the weakest first half since 2022.
Two kinds of money, two different clocks
Official-sector gold demand is mandate-driven and price-insensitive: central banks added a record 288.9t in a quarter when the price fell, and the WGC's reserve survey shows 89% of respondents expect global reserves to rise with a record 45% expecting to add to their own.
ETF demand is the opposite kind of money — benchmark-aware, opportunity-cost sensitive, and fast. It swung roughly $2bn in two weeks on no change in fundamentals. Both are bidding, for different reasons and on different clocks. That distinction matters when the tape turns: one of them will keep buying into weakness and the other will not.
Gold futures positioning was elevated before the news, not because of it
Managed Money net long positioning in COMEX gold stood at 137,662 contracts, up 6,896 on the week. Elevated, but not at the historical extremes associated with crowded-trade risk.
Critical caveat: this reflects positions as of Aug 11, published Aug 14. It predates the Aug 19 Treasury announcement entirely, and also predates the Aug 17 flow turn. It tells us what the speculative community carried into the move, not how it responded. The reaction appears in next Friday's report.
Gold is being bought for what it is not. Silver is not confirming it, copper is pricing tariffs rather than growth, and oil is carrying a risk premium rather than a demand signal. Three of the four commodity signals are being distorted by something other than fundamentals.
Gold/Silver ratio: 66.8 — silver is not confirming gold
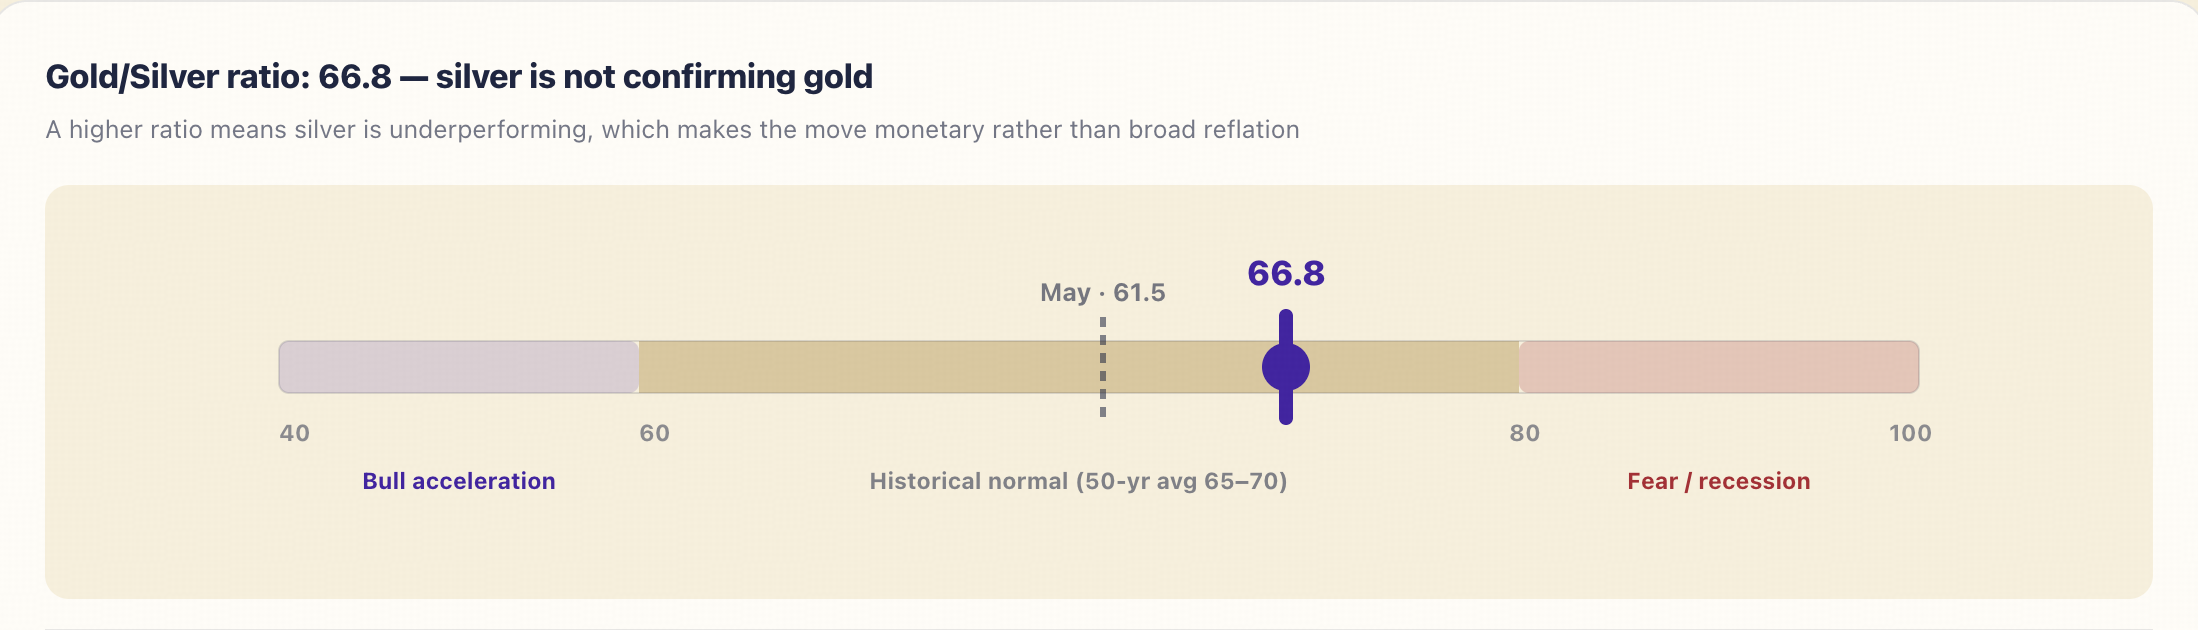
Silver is roughly 70% industrial demand. When gold rallies and silver does not follow, the buying is monetary and defensive rather than a broad reflation. This week that reading gains weight rather than losing it: equities fell and the Nasdaq-100 fell hardest, so the growth side of the economy is not what is bidding. Gold is being bought for what it is not — nobody's liability.
Copper is pricing tariffs, not growth
LME three-month copper settled at an official $13,888/t on Aug 19. COMEX copper set a record $6.714/lb on Aug 12, and close to 70% of all exchange-held copper now sits in US warehouses, some of it economically unable to leave at current spreads.
We are not publishing a COMEX–LME spread figure this week. Our COMEX quote is dated Aug 12 and our LME quote Aug 19; a spread computed across mismatched dates would mislead. What can be said is that the premium has been running at roughly 8.4× its 2005–2025 average.
Practical consequence: the copper/gold ratio — normally the cleanest growth-versus-fear gauge in macro — remains suspended until it can be rebuilt on same-dated LME pricing. Using COMEX copper would read a tariff premium as an industrial expansion and invert the signal.
Oil carries a risk premium, not a demand signal
Brent traded near $93 and WTI near $84 on Strait of Hormuz disruption of roughly 8 million barrels per day. Over the same window OPEC and the IEA both cut their 2026 demand forecasts, and US commercial crude stocks built 17.4 million barrels in the week to Aug 7, reaching 424.4 million — only 2% below the five-year average.
Inventories building, demand forecasts falling, price rising. The difference is risk premium, and risk premium unwinds fast when the news does.
Bitcoin is trading as the high-beta expression of a debasement trade, not as a technology asset. For as long as that holds, Treasury operations and the dollar matter more to price than crypto-native news.
One Bitcoin now buys 15.8 ounces of gold
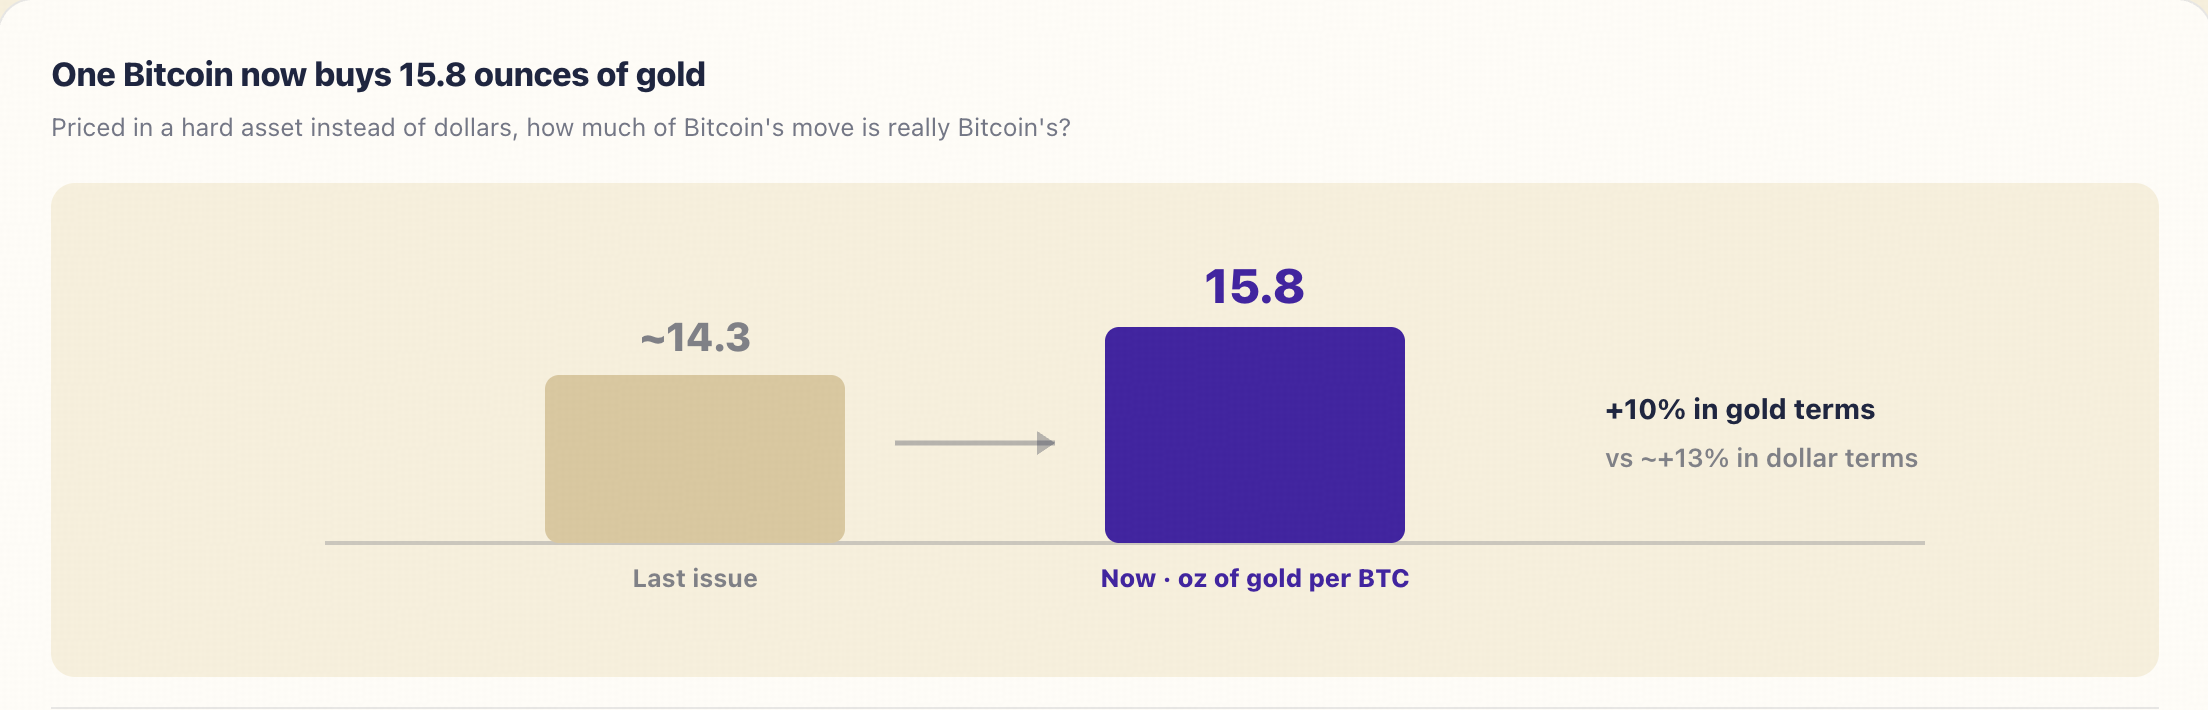
Bitcoin rose roughly 13% in dollars over the period but only about 10% against gold. Most of the move is the same debasement factor gold is expressing; a smaller residual is crypto-specific. Pricing in dollars overstates performance because the measuring stick is shrinking. A genuinely independent crypto bull leg would show BTC/gold rising much faster than BTC/USD — that is not yet what the data shows.
The three-leg test, and what it rules out
The configuration this week was Bitcoin up, gold up, dollar down, equities down. Run through the alternatives:
· A liquidity-beta rally would show equities participating. They fell.
· A risk-off move would show Bitcoin sold alongside stocks. It was bought — $1.61bn of it.
· A dollar squeeze would show credit spreads widening and the dollar rising. Spreads are at 273bp and the dollar fell 0.88%.
Each alternative is contradicted by data. What survives is a rotation out of dollar-denominated financial claims into assets that are nobody's liability — with gold as the conservative expression and Bitcoin as the leveraged one.
And the daily flow data sharpens this. Because the ETF bid turned on Aug 17 rather than Aug 19, the rotation cannot be explained purely as a reaction to fiscal policy news. Something moved allocators two sessions earlier; the announcement then accelerated it.
Positioning read
Constructive on the debasement leg, neutral on the growth leg. The discount-rate move favours long-duration and non-yielding assets; nothing this week supports a cyclical or industrial-demand thesis. Silver and copper — the two metals that need growth — are the two not confirming.
At risk if the dollar reverses. The entire reading depends on dollar weakness persisting. A dollar squeeze would sell everything on this list simultaneously, and credit spreads are the early warning, not the price of gold.
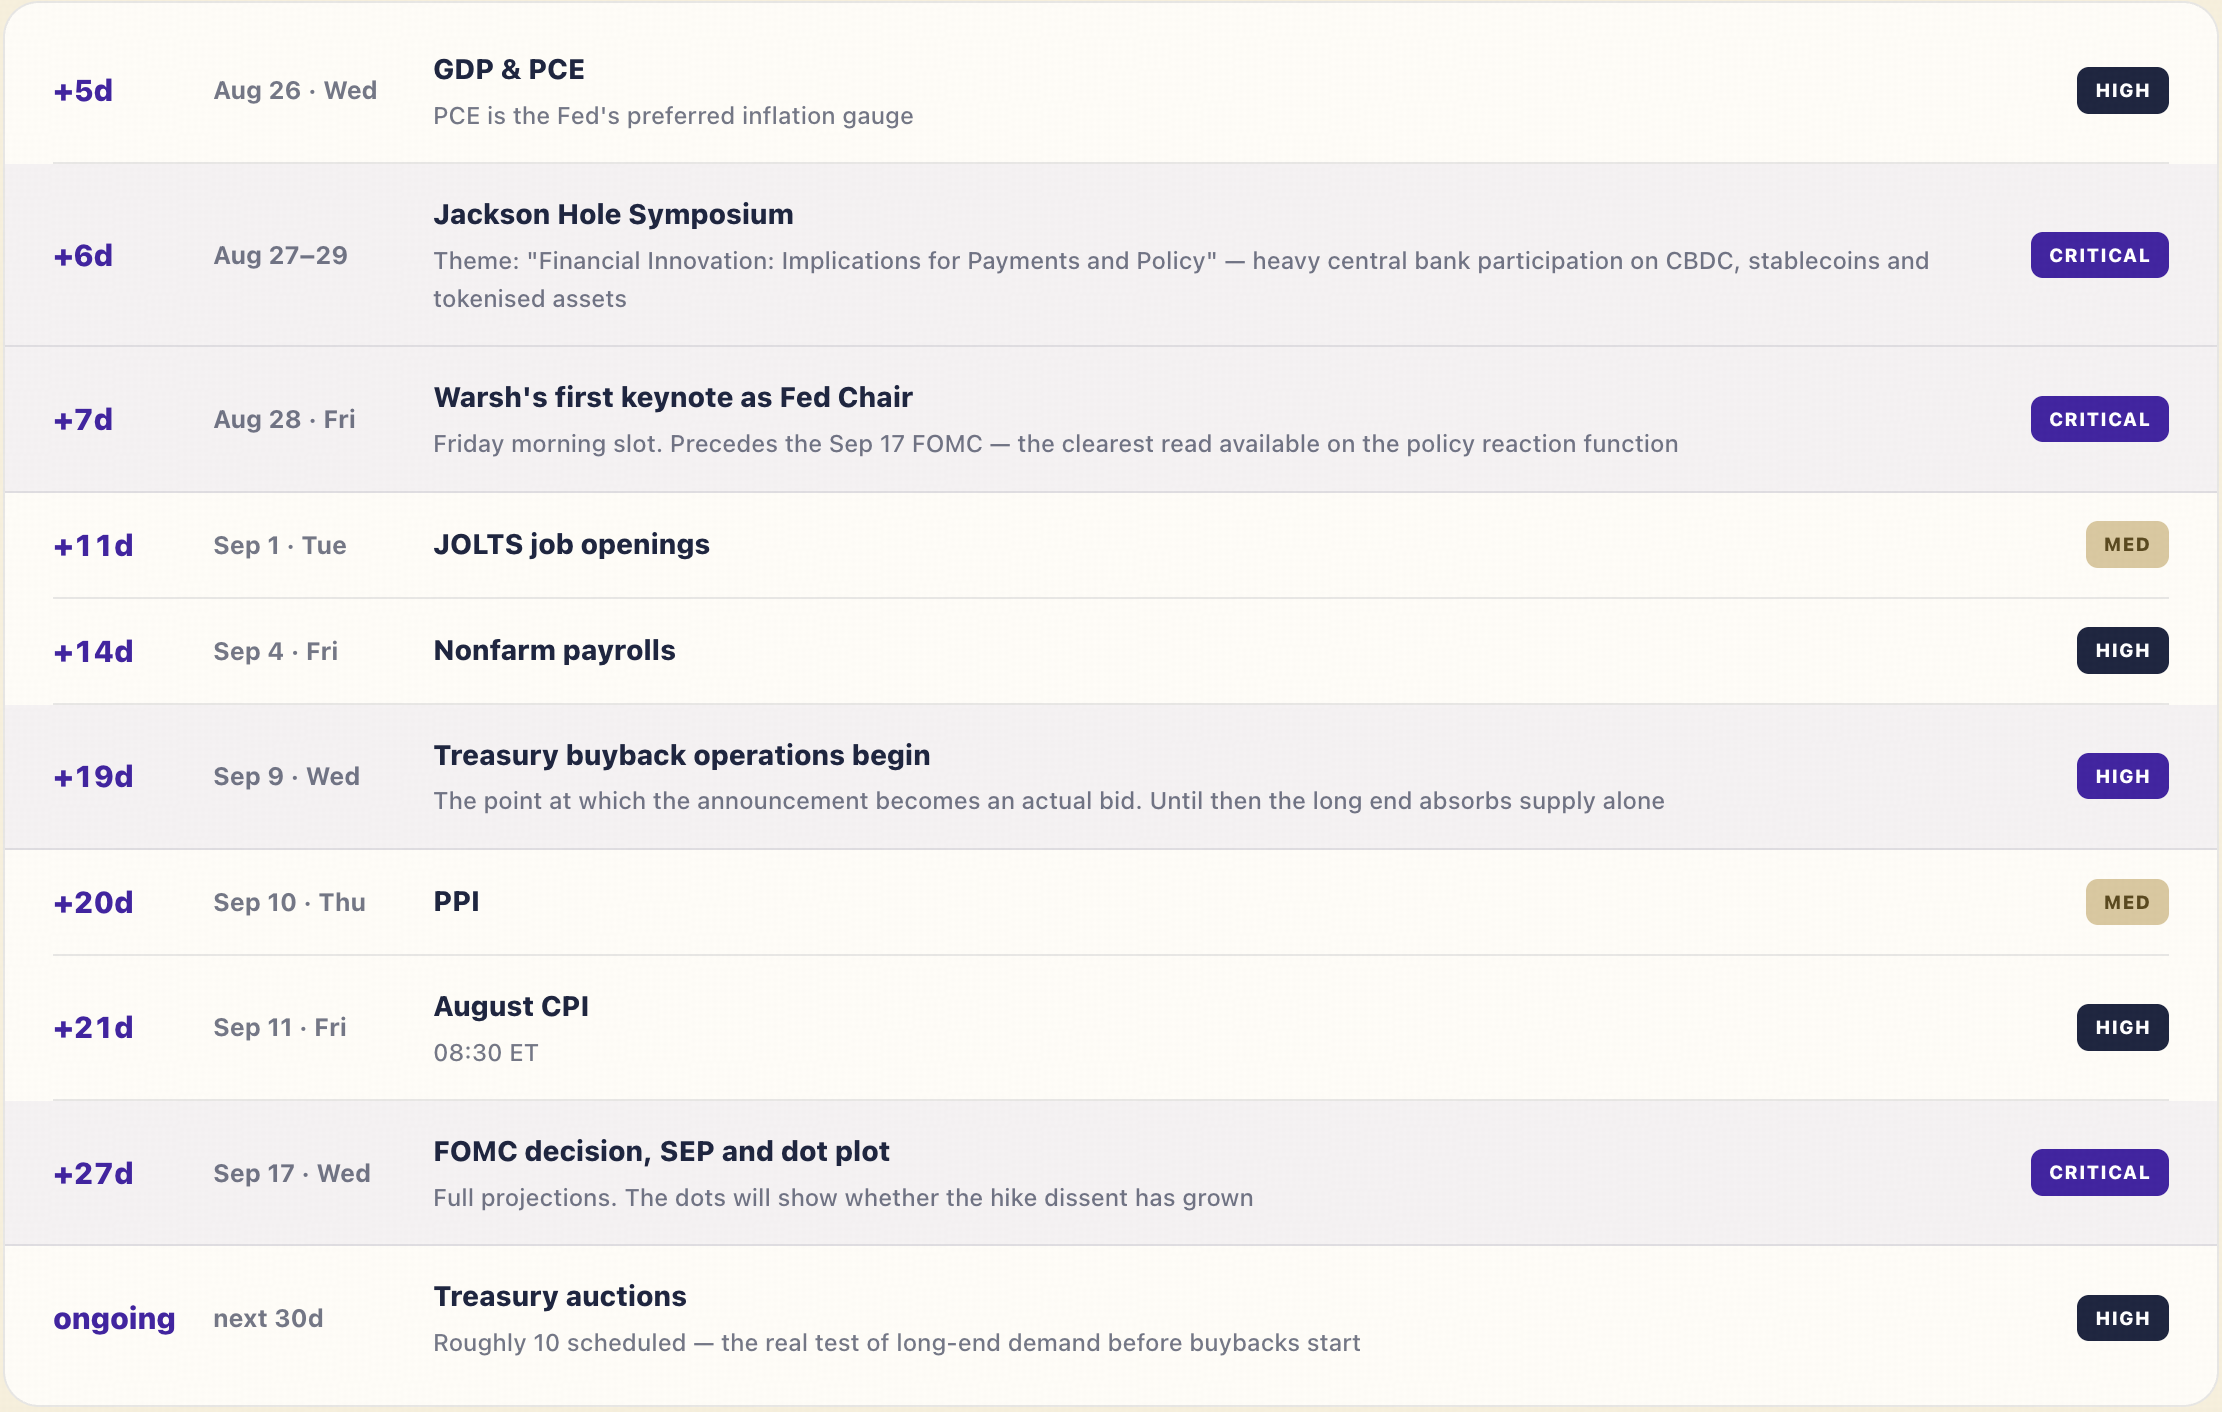
What to watch: Treasury auction demand over the next three weeks without the buyback bid; whether the gold/silver ratio compresses or keeps widening; whether the ETF bid holds through Jackson Hole; and next Friday's COT for how positioning actually responded.
Jackson Hole opens next week with a first keynote from a new Fed chair, and this year's theme is financial innovation, payments and tokenised assets. For a report that sits between TradFi and crypto, it is the single most important date on the board.
Equities repriced for duration. Gold and Bitcoin repriced for the currency. Those are two different trades, and only one of them was about risk appetite.
Sources: Kitco, FRED, Farside Investors, World Gold Council, CFTC, EIA, LME, Kansas City Fed.
TokenInsight · TradFi Weekly. Not investment advice.
 APP
APP